The study compares 2022-24 Household Consumer Expenditure Survey data with 2011-12, highlighting poverty and inequality changes.
Key Findings
- Poverty headcount ratio (HCR): Poverty HCR, at the $1.90 PPP (Purchasing Power Parity) the poverty line, has dropped from ~ 12% in 2011-12 to 1% in 2023-24.
- Poverty HCR: Percentage of a population living below defined poverty line.
- Poorest households: Saw significantly higher growth in consumption expenditures than wealthier households.
- Existing official poverty lines (Tendulkar and Rangarajan): Are outdated and don't reflect current deprivation.
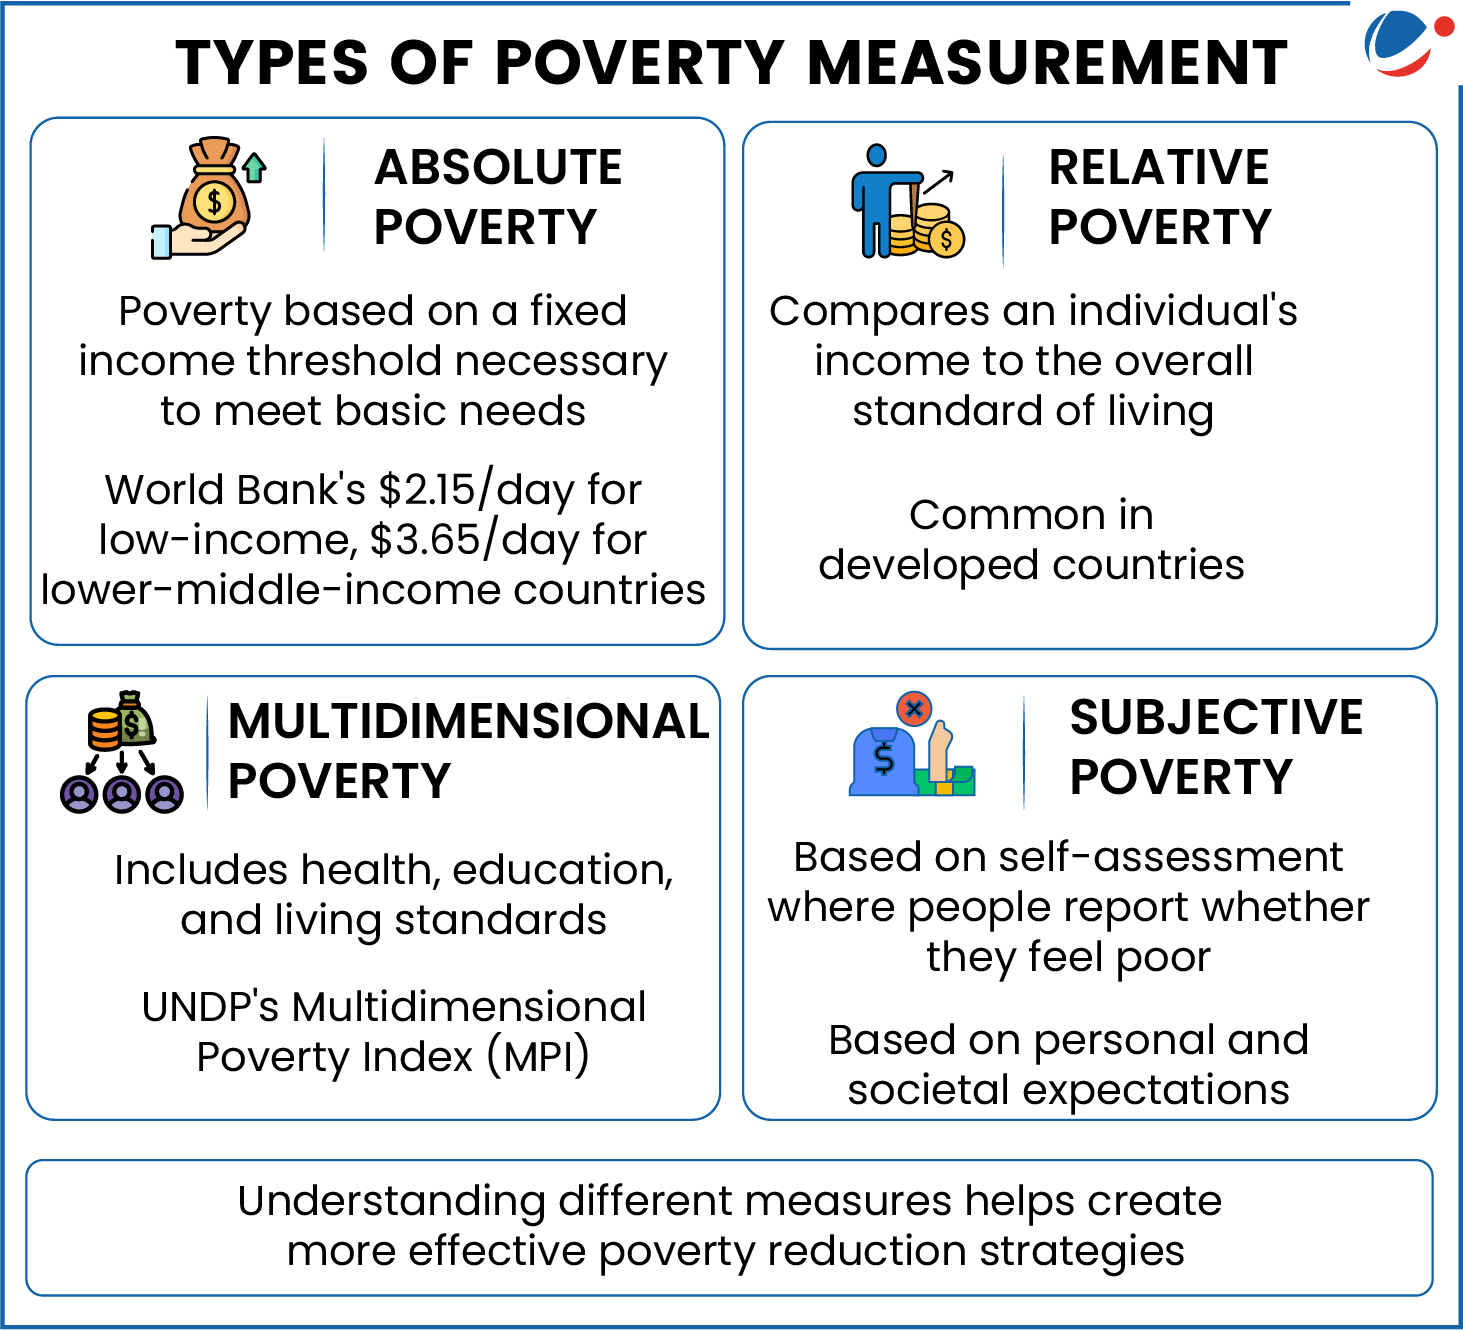
The Study Proposes Two New Relative Poverty Thresholds:
- Relative Poverty Line Based on the 33rd Percentile of Consumption: Instead of using a fixed poverty line, Poverty is defined based on the spending of the bottom 33% of the population.
- Relative Poverty Line Based on Income: In Europe, poverty is defined as 60% of the median income (Middle income level when all incomes are arranged in order).
- Applying this method to India, 16.5% of the population was below this threshold in 2023-24.
New Poverty Line Significance:
- Reflects updated consumption patterns, addressing current deprivation.
- Ensures poverty thresholds adjust automatically with economic growth.
- Provides a more accurate measure of poverty in modern India.
